

I get it, you’re busy (same). As a result, I’m guessing your financial “review” process looks something like this:
Sales are up (nice)
Profit isn’t up, but looks fine (ok)
Cash feels tight anyway (hmm…)
Archive email and move on
Let’s see if I can get you to do more while consuming less time.
Normally, I wouldn’t advocate a corner-cutting activity like “speed reading” your financials; but if it gets more operators to take action with their numbers, then I’m all for it.
So consider this the “gateway drug” for deeper financial analysis.
(Note: at the end, I’ll give you a sample set of numbers to practice with.)
Step #1: Get Reports (5 minutes)
We need the right information to review before we can start speed reading.
There are several timeframes you could be looking at (weekly, monthly, quarterly, annual), but we’re focused on a plain vanilla end-of-the-month financial review here.
If I’m attempting to get up to speed very quickly, then these are the 3 reports I’m pulling down:
Income statement on a rolling 12-month basis for the past 12 months — Of any financial report, this one is the best pound-for-pound value out there. Every column represents a full 12-months of P&L data which removes all seasonality and smooths lumpy revenue and expenses.
Cash flow statement on a rolling 12-month basis for the past 12 months — Same format as above, just using cash flow statement data instead of the P&L.
Balance sheets for the past 3 years and 3 months — The balance sheet is a snapshot, not a period of time, so you don’t need the rolling 12-month treatment here. A few years + months in a single report will show us how assets, liabilities, debt, and equity are moving over time.
Each of these can be prepared on a single page, so we’re talking 3 pages of reports here. Simple enough.
P.S. if you’re outsourcing bookkeeping or have an accountant, then perhaps you can get this step down to 0 minutes :) reach out if you want help here!
Step #2: Simplify Information (5 minutes)
You probably wanted to jump straight into the numbers, right?
But before looking at a single number, you need to simplify as much information as possible (fortunately, I walked through the steps to do this recently).
Note: this rule is doubly true if you’re attempting to do quick analysis. Without this step, your eyes are going to roll into the back of your head.
My generic rules for “simplifying” financial info?
Round off all decimals and collapse revenue and expenses into the fewest lines possible (I call this “condensing” your financial information).
This is going to be much easier on your eyes when it comes to quickly spotting trends. Every great analyst uses this tactic.
Once you’ve condensed each report, you’re ready to go.
Statement #1: The Income Statement (~10 minutes)
The income statement (or P&L) tells me how the business model and profit model are working on an accrual basis.
In a quick review, we’re trying to get a sense for 2 major items:
Is the business directionally growing or shrinking (revenue, margins, expenses, profits)?
Does the business primarily have a revenue problem or a cost problem?
Run your eyes down the rolling 12-month income statement and ask:
Is revenue growing, flat, or declining? Note: This is only a high-level view and won’t reveal volume/price/mix changes within your product or service offerings.
Is net profit growing, flat, or declining? I want more net profit growth than sales growth (leverage). If I don’t have this, then it must be the result of either gross profit or overhead expenses.
Is gross profit growing, flat, or declining? Ideally this is moving in the same direction and at the same rate as sales (i.e. if sales go up by $1, then GP should go up at least $1); if not, I have a price/mix/cost problem.
Are fixed costs (i.e. overhead) increasing more than sales? These expenses should grow at a slower rate than sales (i.e. sales up $1, overhead up less than $1).
Remember, this is a quick analysis, not a deep dive. We’re trying to quickly size up the business and determine where the problem areas might be for further investigation / fixing.
For a first pass, the P&L is fairly straightforward.
If revenue is not growing, then you’ll want to know why. It is very difficult to grow or maintain profitability over long stretches without revenue growth. Solve this first.
If net profit is not growing while sales are growing, then it must be either a gross profit or overhead expense problem. The former means I need to address my pricing, mix, or cost to sell/deliver; while the latter means I need to assess my fixed cost base.
Statement #2: The Balance Sheet (~10 minutes)
The “bodies are buried on the balance sheet” as they say… translation: business problems typically reveal themselves on the balance sheet (debt, working capital, lack of equity, mis-recorded items, etc.).
Taking a step back — the balance sheet exists to serve its master, the income statement. We buy assets to create sales (and earnings). Assets are funded by liabilities (vendors or lenders) and/or equity (owners/shareholders).
Example: A consulting firm doing $5m in revenue with a laptop and a small team is fundamentally different than a manufacturer that needs $5m in equipment and inventory to do the same amount of revenue. The balance sheet tells you which kind of business you’re dealing with.
A few places I like to look here:
Retained earnings — tells me whether a business has a history of sustained profitability
Debt / leverage — loan balances are a measure of risk, solvency, etc.
Working capital — efficiency; too much and cash runs dry, too little and sales run dry
Fixed assets — indicates whether the business needs a lot of physical “stuff” to operate
The “other” stuff — intangibles, leases, deferred liabilities, etc. — this grab bag could hide unexpected risk or opportunity (probably worthy of its own deep dive)
When staring at a profitable business where the cash isn’t piling up, chances are it’s sitting somewhere on the balance sheet.
Statement #3: The Cash Flow Statement (~10 minutes)
Profit vs. cash flow is arguably the foundation of any business.
You don’t need to be an expert on accrual accounting to read financials and “profit vs. cash flow” gets you 80% there (while the balance sheet fills in the gap).
Profit = money left after covering expenses (i.e. what a business makes)
Cash flow = money coming in minus money going out
So what’s the difference?
They run on 2 separate cycles with separate drivers…
Profit happens as revenue & expenses are recorded (on paper) while cash flow is all about timing (when it hits the bank account). The key is to the know drivers of each. It’s like clocking in for work on Monday while getting a paycheck on Friday. The P&L shows a “profit” on Monday, but no cash flow.
A brief list of things that drive profit and cash flow differences:
Profit drivers — sales volume, pricing, product mix, margins (all of ‘em), cost structure, financing
Cash flow drivers — collections timing (A/R), billpay timing (A/P), inventory, depreciable assets (capex), debt service, funding, accruals and other stuff not yet paid, stock comp
So what should you be looking for here?
The cash flow statement breaks down into three buckets:
Operating cash flow — Cash generated from the actual business operations. This should be your primary source of cash and it’s closely linked to profit. If this is consistently lower than net profit, ask why. Common culprits: slow-paying customers (receivables), inventory building up, or payables getting stretched.
Investing cash flow — Cash spent on long-term assets like equipment, vehicles, software, acquisitions. Investing cash outflows aren’t automatically bad (might mean a growing business is reinvesting), but it does explain where cash goes.
Financing cash flow — Cash from (or to) lenders and owners. If you have loans, this is where you’ll find the principal payments.
The key here is whether operating cash flow is reasonably close to net profit.
If a business is earning $500k in profit but generating only $50k in operating cash flow, something is soaking up cash (and probably sitting on the balance sheet). Your job is to find it.
TL;DR
There are all sorts of tools and metrics we can apply here but before that we need good financials to make good decisions (both as an operator and investor). Good financials and good analysis are joined at the hip.
For now — The best way to get better at dissecting financials is to start looking at them regularly. Use your business, a target business, competing businesses, search for public companies in your industry (or any industry). Treat this like reps in a workout.
Homework
Now’s your chance to put some of this into practice.
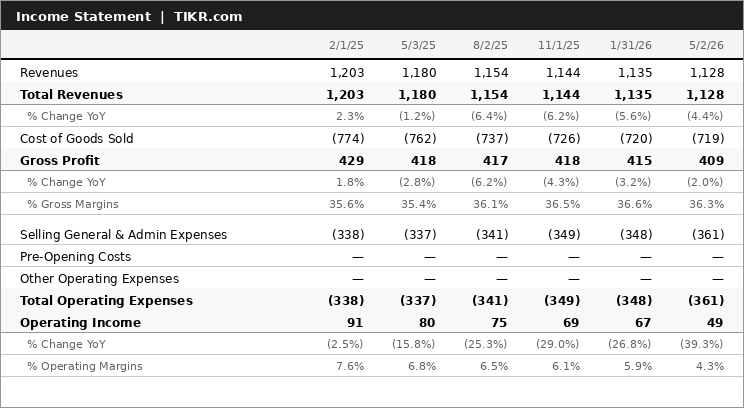
Below is a condensed, rolling 12-month income statement, ready for your review!
Using what you’ve learned above:
What are the key trends you see here?
What additional questions do you want to know to help this business?
P.S. If you want help sorting through your own numbers, then become a Profit Mastery Pro member using the button below.
We teach businesses how to read & use their numbers, then offer ongoing support via calls, chat, and workshops to keep you on a path to more profit + cash flow.