
Winners & Losers
Your sales mix shows you the winners and losers hiding inside your top-line revenue.

What’s Inside Your Top Line?
Here’s a situation…
Sales last month were $140,000 and the same month last year was $120,000, a 17% year-over-year (YoY) increase.
I’ve been preaching that you should know this number (your YoY growth rate) like the back of your hand, and you should.
It’s a bit misleading though, since the 17% growth and $140,000 sales figure are a 30,000-foot “zoomed out” view of the business.
But what’s actually inside that $140,000?

What’s a sales mix?
Most companies have multiple product or service offerings.
ApparelCo sells t-shirts, jackets, pants, shorts, and accessories
ManufacturingCo sells a high-end product, mid-range product, “value” product, and parts/components
ServiceCo sells an hourly rate, monthly retainer, and various fixed fee services
This collection of different offerings in the catalog is your product mix/sales.
On top of that, you probably sell them in more than one place (ex: a physical storefront, a website, Amazon, wholesale accounts, distributors, etc.), these are known as sales channels.
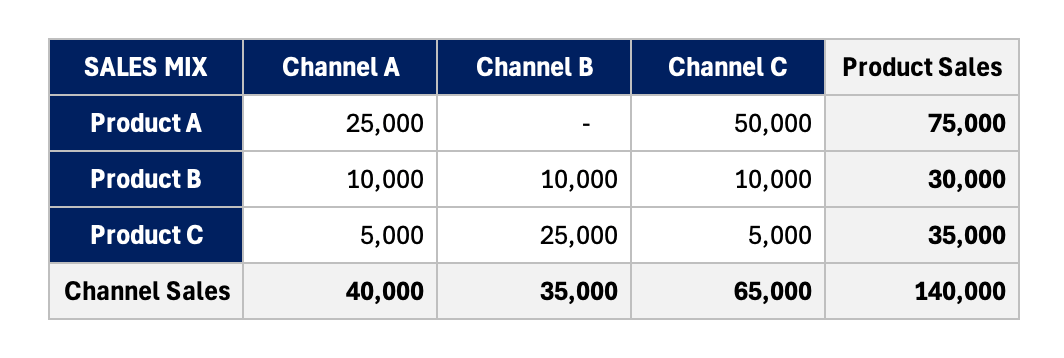
Sales Mix = revenue broken down by product/service and sals channel
Think of it like a grid or matrix with products down the side and sales channels across the top. Every box in this grid is a stream of revenue adding up to your total revenue for the month.
Here’s what it might look like for our $140,000 sales:
Why does this matter?
Imagine your business is a cruise-liner and total revenue is the tip of an iceberg, it’d be helpful to know what’s lurking beneath the surface, right?
Let’s take a look at the same information split between product mix and channel mix, then you tell me why this might be important…
Here’s the product and channel mix for the past few months:
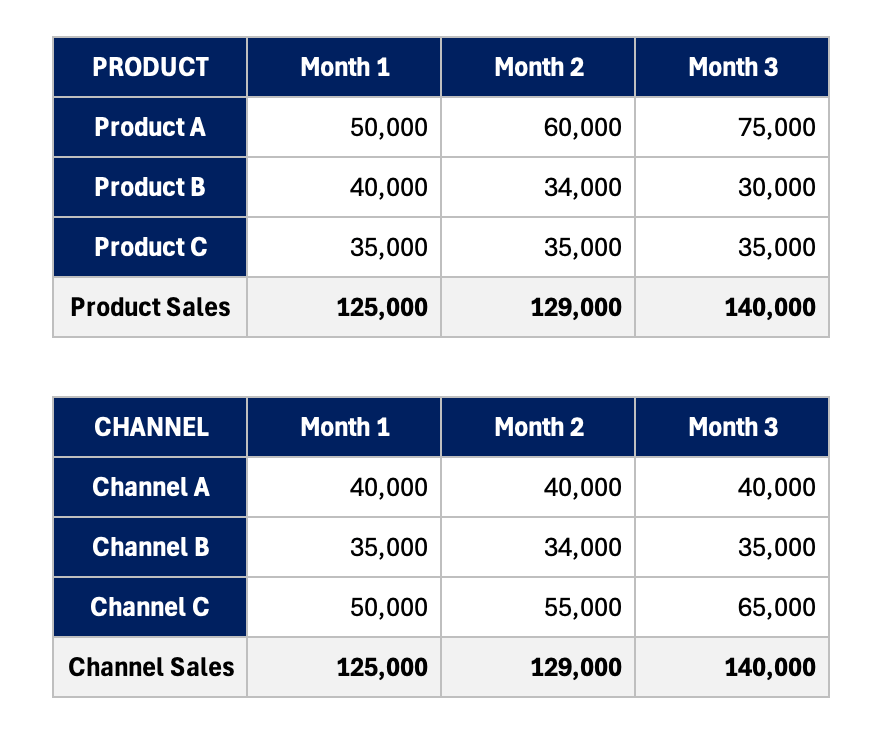
See any opportunities or challenges in here?
Product A is a growth gem — ramping from $50k sales to $75k, and it’s not even being sold through Channel B (huge opportunity?)
Product B has some issues — what’s going on here?
Product C is flat — maybe time to refresh the sales pitch or marketing materials?
Channel A & B are pretty stagnant — worth investigating why no traction here
Channel C is the growth engine and maybe we should invest in growing Product B & C there?
Your “mix” matters because it gives you a beneath-the-surface look at those sales figures which help you find the winners and losers in your catalog (i.e. where you should be investing more and where you should be pulling back).
Without this view, you might be throwing money into shrinking or low-margin products and channels.
Business is all about doing more of what’s working and less of what isn’t.
Where do you even get this?
This is why having good data is so important.
Without reliable data, you’re piecing this together manually (which is still worthwhile, but probably relegated to a “few times a year” cadence).
Let’s say you’re invoicing wholesale customers out of QuickBooks for one channel, Amazon deposits into your account for another channel, you take cash sales at the register, and you have a POS system for a physical storefront.
That’s 4x sales channels and sources of data, and it’s on you as the business owner to combine them in the right way.
How do you use this information?
Here are 3 basic ways to put this to work tactically:
Product opportunities — First, I want to see which products are growing the fastest and which products are declining. The former group, you want to throw more resources at (advertising, marketing, sales, etc.). The latter group you either want to cut or stop investing in them.
Channel opportunities — Do the same exercise for your sales channels. Which channels are working best? Are there any products not available on those channels that you could get over there? Are there any channels missing that would be easy to add? In the example above, maybe there’s a “Channel D” which could be easy to start selling through.
Unit economics — Last, I want to review how profitable each of these products and channels are, known as my unit economics. This will tell me if certain products and certain channels are more or less profitable than others. This is a huge deal… let’s say the declining product from above (B) was the least profitable and nearing 0% margins, I’d argue you should stop selling it immediately!
This isn’t a report you need to stare at every week, but it’s worth a review a few times each year (I’d recommend a quarterly cadence or every 3-4 months). It’s especially valuable for annual planning when you’re preparing for price increases.
TL;DR
Top line revenue only reveals a 30,000 foot view of the business
Sales mix is the “beneath the surface” view of revenue
Revenue (Sales Mix) = product/service mix and channel mix
The sales mix reveals growth and margin opportunities for your business
Invest in good data to get a clean view of your sales mix
Review this a few times each year, especially during annual planning (price increases)
Homework — pull last month’s sales and split them into your top 3–4 products and your top 3–4 channels. Don’t aim for perfect accuracy, just get something on paper. I’d bet there’s at least one thing surprising you in the end.
Become a PM Pro Member
This Friday (June 12th), we’re hosting office hours for members to get 1:1 help with their business, bring those burning financial questions
Profit Mastery is a Financial Operating System for running the financial side of a business — become a member using the button below