
Find Your Economic Engine: Unit Economics
How to know if each sale is actually making money, then what to do about it

Most business owners set prices with one of these approaches:
Look at what competitors are charging and use that
Ask customers what they’re willing to pay
Gut feel
We can do better.
Your unit economics tell you whether each sale is actually making money and what you need to charge for every item on the menu.
We’ve talked about the ability to both zoom out and zoom in when it comes to reviewing the financials.
Zooming out includes reviewing multi-year financial trends and forecasting years into the future. Think of zooming out as strategic in nature or “what-if” scenario playing.
Unit economics are a “ground floor / zoom in” view of the numbers and they’re very tactical in nature.
This is where you’ll spend time reviewing your product and service offerings, how those products and services are priced, and where to identify cost & efficiency savings at the product level.
What are unit economics?
Unit economics are the selling price, direct costs, and profit of a product or service measured one sale at a time.
An example will help this make sense…
We just opened for business and we’re trying to figure out how to price our products to make some money (i.e. eventually hit break-even and target sales).
Unfortunately, there’s no “universal guide” outlining every cost that goes into making, delivering, or selling your product or service. Which means we’ll need to brainstorm and create this list on our own and as thoroughly as possible.
Adding to the fun, we likely have a “hotdogs & and hotdog buns” situation here (you know: one comes in a pack of 8 while the other comes in a pack of 6). None of our costs will be clean cut on a per unit basis. We’ll have to do some estimating along the way.
Our business just opened and we’re running a coffee shop… looking at the menu, we decide to start by identifying the unit economics for a basic cup of coffee.
We need cups, sleeves, and lids to hold the coffee. Our supplier quotes the following:
$50 for 100 cups,
$20 for 100 sleeves, and
$20 for 100 lids.
This works out to $0.90 per cup just for the container.
Next, we buy a bag of coffee beans for $100 (it’s good stuff).
How do we figure out the “per cup cost” based on that price?
Well, we probably need to look at our equipment and how many cups it can make out of a single bag of beans. Turns out, we can get 100 cups out of a single bag. In this case, we’re at $1.00 per cup.
Last, we can’t forget about direct labor, those baristas are working hard. We need an estimate of how many labor dollars go into each cup of coffee sold.
Here’s one approach:
Let’s take our total staffing cost and divide by how many cups of coffee were sold over some period of time. Now, we don’t want to look at a single hour or a single day because that could give us really misleading results. It probably works best to look at this over a 3, 6, or 12 month period of time and update once a year or so.
After reviewing my payroll reports, I find that total payroll cost was $1,000 over the last 3 months. During the same timeframe, we sold 1,000 cups of coffee for a per unit cost of $1.00.
This is not perfect, because some labor exists whether you sell 20 cups or 200 cups in a day. But it gives us a useful starting point. Over time, we can separate “labor to keep the doors open” from “labor required to produce each additional sale.”
So I have:
$0.90 for the container,
$1.00 for the coffee itself, and
$1.00 for direct labor.
Combined, that gives us a total per unit cost of $2.90.
What to do with this information?
There are three really good use cases for this for a business owner:
As a pricing tool — what to charge
As a product guide — where to invest
As a product “portfolio” tool — building the right mix
1) Pricing tool
If you do a cost buildup and fully understand every cost that goes into making and delivering that product or service, then it becomes very easy to get your desired margins out of it. The more thorough you are, the more stones you turn over in that process, the more accurate the number is going to be.
At a minimum you should look at your unit economics each year for your core products and services to see how the input costs have changed. You want to make sure you are methodically increasing prices to offset those changing costs every year.
2) Product guide
Which products make you the most money?
These are the ones that you should be pushing the hardest. If you do this exercise and find that you can’t price some products with a good margin because it’s a commodity or the market won’t support the price you need, then it’s a clear indicator this shouldn’t be a primary or core product in your portfolio. Find other ways to make sure you have some high margin offerings.
Example: customers won’t pay more than $3 for a cup of coffee which generates very little profit for you… perhaps a specialty drink sold at a premium with rotating flavors & recipes has better unit economics?
3) Product portfolio
Think of your “menu” as a garden you’re tending. We need to plant seeds, water the flowers, and pull the weeds. The combination of what you sell works much the same way.
If you don’t have any products with high margins or high product profit dollars, then that’s a gap in your portfolio.
If you have some low ticket and/or low margin products, then those can be great marketing tools or giveaways or gateway products to get people in the door and eventually up-sold to your best products.
If you have products with negative margins (i.e. losing money on every sale) and it does not drive other profitable sales, then consider cutting these to improve your overall profitability. This is low hanging fruit.
These concepts work for service businesses too, so don’t assume it only works for product-oriented companies.
Example: my service business sells a monthly recurring service offering and also a one-time “quick review” offering; I may want to offer that quick review at a very low price to get people in the door for my recurring work which has better margins and profit dollars.
Back to our example company…
Starting with pricing. Based on our break-even calculation, we found that we need 40% contribution margins to hit our profit target. That’s a helpful reference point when it comes to pricing our products and services.
Based on the total cost for this single cup of coffee ($2.90), we would need to price it at $4.83 in order to achieve that margin target ($2.90 ÷ 60% variable costs = $4.83 selling price at a 40% margin). Maybe we round up to $5 to add some “buffer” for missing costs; or round down to $4.50 if we were overly conservative.
Then, we repeat this exercise annually to see how we should adjust our prices each year.
We’re now two years into business and we’re reviewing our unit economics for this cup of coffee and some other products. Here’s a table of what our costs look like over the past few years without any changes in pricing:
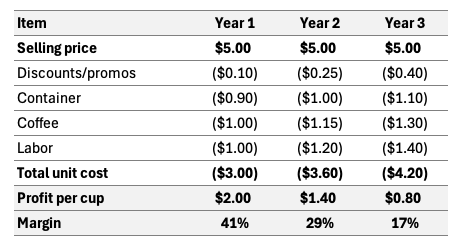
Besides pricing, what are some things you notice here that we could potentially improve?
For starters, we’ve been discounting too much. The coupons and marketing promotions are increasing each year at a time when our costs are going up, that’s not good for margins.
Raw materials and labor have increased over the years as well. Those are good candidates to pass through via pricing.
Direct labor is its own interesting animal in that maybe we can find ways to be more productive and efficient which could reduce the labor hours needed per unit sold. When you hear stories of big companies like McDonald’s saving labor hours using things like technology, this is where it shows up in their financial picture.
How do you implement this?
Start by tracking it over time. The Profit Mastery System recommends a minimum annual review of your unit economics.
That review involves analyzing your historic costs to see what it actually cost you to make, deliver, or service those sales. Your business will have different cost components, but the process is the same:
Identify the unit,
Estimate the direct costs,
Compare them to price, and
Look for margin improvement.
This sounds like a rigid process where you’re calculating a bunch of numbers and then backing into a price… but really, you’re trying to find an economic engine that’s going to make you a lot of money which is also easy to market and sell.
There’s more creativity to your unit economics and product portfolio than you might imagine.
Case study: the creative side of unit economics
One of my favorite examples is the restaurant Cooper’s Hawk.
It’s a highly competitive industry (restaurants) but they found a unique approach to adding subscription income and differentiated revenue streams.
If you’ve never been… Imagine you’re on a date with your significant other and you show up for a wine tasting. You sample a bunch of wines, they charge you a per person rate, then they tell you to join the monthly wine club so you can get the tasting for “free” along with 2 bottles of wine every month. That’s the subscription side of the business which is profitable and feeds traffic to the restaurant.
Since you’re a subscriber now, you’re coming back every month to do your tasting and pick up your wine bottles. Since you’re there, you might as well stick around and have dinner too, and it’s an upscale dining experience which is a bit higher margin.
So now you’re taking a periodic visitor and turning them into a subscriber who is visiting frequently. That’s on top of your regular restaurant visitors.
It’s a pretty cool way to “flip the script” on an otherwise commodity type industry.
So never assume there’s nothing unique about your business and there’s no way to incorporate premium product or service offerings into what you do!