
A Guide to Scorecards (Part III)
Looking at the tactical side of using your ratio scorecard (action)

The best operators know their numbers cold AND what to do with them.
“An organization's ability to learn, and translate that learning into action rapidly, is the ultimate competitive advantage.” — Jack Welch
We use a ratio scorecard to flag trends in the numbers, then we dig into the drivers of those ratios, then we take action to course correct.
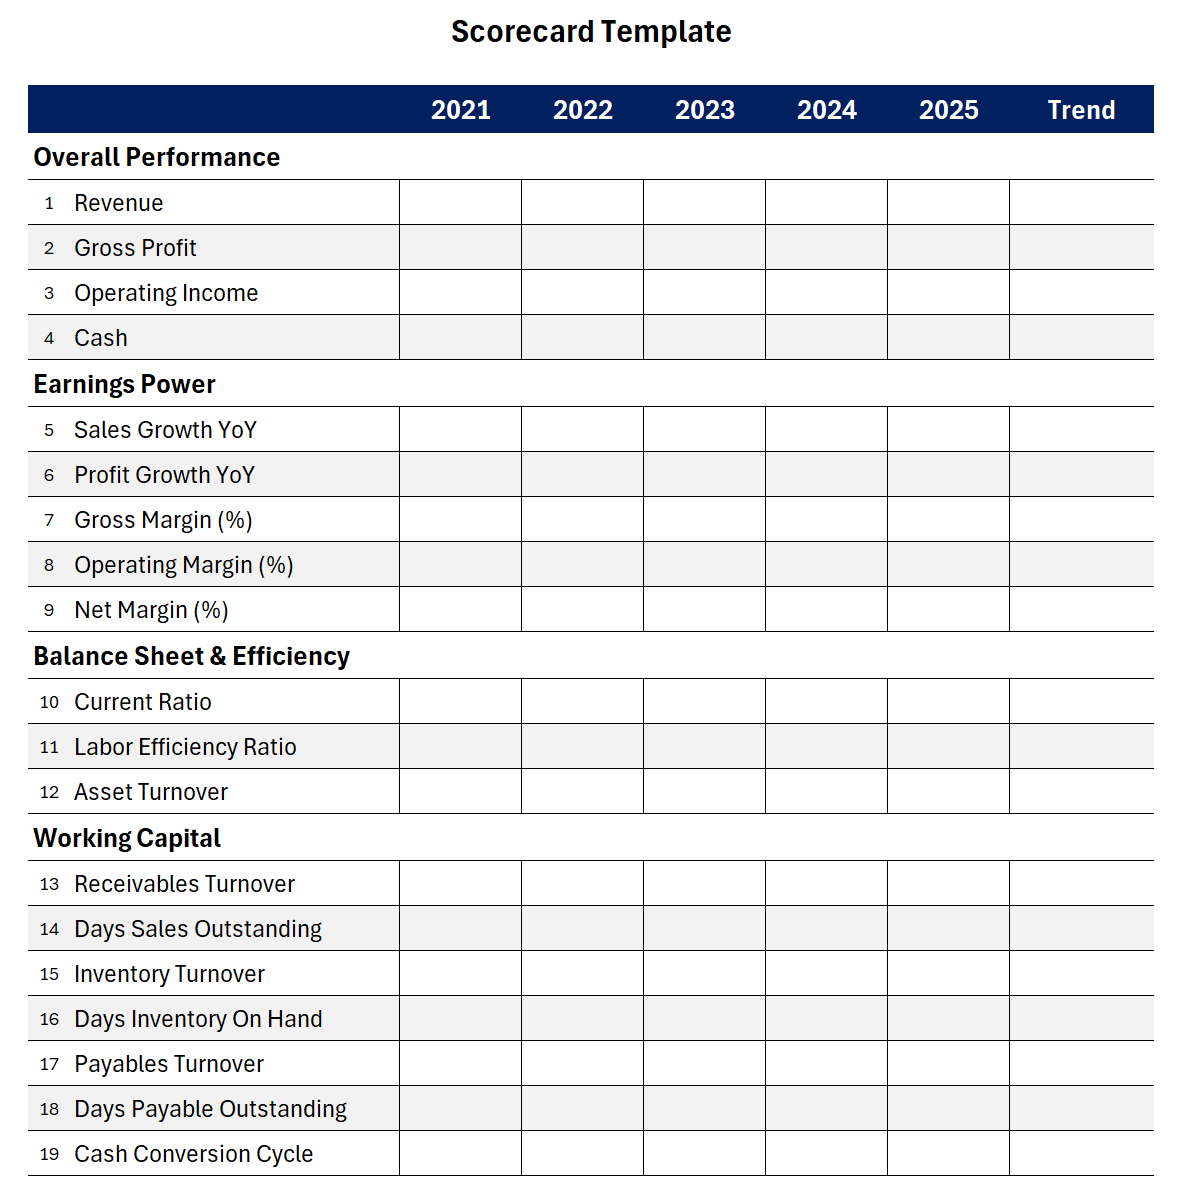
Check out the guide on building a ratio scorecard here:

If you’ve been following along, you should have a scorecard with key metrics and ratios for your business model and financial situation; and you’re ready to get tactical with it…
Now, it would be impossible to cover the tactical side of using this tool for every business, in every financial situation, so I’m going to focus on 2 areas that I see frequently.
Hopefully this “investigate — analyze — action” framework will help you use this tool on your own numbers.
Using the scorecard
For starters, here are the 3 primary ways to use your scorecard:
Track your numbers across time — you want to know whether your business is directionally becoming more efficient or less efficient (“the trend is your friend”)
Establish a baseline range or average — this makes it easier to see if current performance is inside or outside your normal baseline
Compare to industry averages (benchmark) — it helps to know if your metrics/ratios are better or worse than peers or competitors (where do you rank amongst the group)
Running a business is dynamic, not linear. Your numbers won’t move in a straight line. It’s far more helpful to find a baseline (range) for each ratio than rely on a single point-in-time measure by itself.
Clearly, you want that baseline to be a tight range (i.e. 52-55% vs. 45-60%), but having a baseline helps you avoid excessive worrying when results fluctuate up or down.
Interpreting the results
Let’s try this process for 2 ratios on our scorecard. We’ll look at the trends and determine which actions are available to us.
Gross margin; and,
Marketing efficiency ratio (MER).
1) Gross margin
We use this ratio to measure profitability at the sale level (i.e. after covering all direct costs to make, produce, or sell). The formulas are:
Gross Margin = gross profit ÷ total revenue
Gross Profit = revenue - COGS
Let’s say you’re a few years into running the business. Revenue has been growing steadily from $1m to $1.275m (revenue growth hasn’t been a problem so far). But profit doesn’t seem to be following…
You update your scorecard for the past few years and months, noticing the following trends:
67.5%
66.0%
62.0%
63.0%
57.5%
It doesn’t take a rocket scientist to figure out a 10% drop in gross margin is a lot, but it does require some investigation to figure out why. On $1.275m annual revenue that’s $127,500 lost profit; enough to pay for another employee, more marketing campaigns, or extra take-home for yourself.
So what do you think is happening here?
First, let’s think about the inputs to gross profit and gross margin:
Total revenue = Average sale price x volume x customers (new and returning)
COGS = materials, labor, shipping, processing fees, royalties, etc. (completely dependent on your business model)
These inputs help us identify why and where gross margins might be declining… which leads us to the tactics to influence this ratio:
Raise prices — perhaps you’ve neglected to raise prices for years (while costs have increased each year); this one is simple, but often overlooked, when was the last time you raised prices?
Discounting — it’s easy to give away 10-20-30% of a sale to entice a prospect to buy… this kills gross margin
Unprofitable customers — some companies “give away” very attractive pricing to lure a “whale” customer… only to find out months/years later that the customer doesn’t generate any profit and/or consumes a ton of capacity
Volume — for the high-fixed-cost-businesses out there (manufacturers, distributors, some professional services), more revenue is need to spread across those fixed costs
Revenue mix — it’s likely you have more than one product/service offering, and those offerings likely have different price points and profitability levels… think about your revenue as a pie chart with all those offerings, we call this your “revenue mix” — if you’re selling more of your lower margin products, that will drag gross margins down
Materials — costs are higher for the things you sell or make… if you can’t increase pricing as an offset, then you need to be thinking about improving efficiency or finding new suppliers / reducing your material costs (buy in bulk, run an RFP, or negotiate with your own suppliers, etc.)
Labor — if direct labor costs are rising faster than revenue, then you might have a labor efficiency problem… send hourly workers home early if things are slow or investigate where workers might have inefficiencies or are slowing down completion of sales
Other costs — you have less control over certain expenses (like CC processing fees, royalties, and shipping costs)… with shipping you can negotiate better rates as you scale; for the others, just make sure you’re consistently passing along cost increases with pricing
This is just a short list of items which could be quietly eating into your gross margins… if you brainstorm enough, you can probably add dozens of other areas to investigate.
2) Marketing efficiency ratio
In addition to the gross margin weakness, we notice the business is spending large and growing sums on marketing & advertising each year, so we decide the Marketing Efficiency Ratio (MER) is worth tracking.
MER = total marketing expense ÷ total revenue
This ratio tells us how much we’re spending on marketing per dollar of sales (i.e. 5% = 5c marketing spend per $1 of sales). Here are the last few readings on marketing efficiency:
6.0%
6.2%
8.0%
8.5%
8.9%
This business is spending a LOT more on marketing than in years past… from 6% of sales to almost 9%, this expense category is eating into margins to the tune of 3% per year (that’s a $30,000 profit hit for every $1m in sales).
Is this a bad thing?
Each dollar spent on marketing should be productive for your business. If not, you have an efficiency problem.
Based on the MER trends above, we should expect revenue growth to accelerate in the next few months.
To measure this, I’d check how growth is changing over time. Let’s say the business was consistently growing 2-3% per year (back when we were spending 6%)… if that growth is accelerating to 5-10% or more, then the additional marketing costs are working for us.
If growth is slowing (or non-existent), then I’d consider the additional costs as inefficient and worth reviewing or reducing.
Some tactics we can use to address our MER:
Reduce marketing budget — be careful here, if you were spending $2k per month and cut to $1k per month, your goal would be no change in revenue (i.e. eliminate the inefficient spend)… treat this as a “test” and reverse course if sales trends worsen
Shift your marketing budget — modern businesses are brainwashed into thinking digital ads on Google or Facebook are the only outlet for marketing dollars… explore other channels to spend on revenue-generating ads (look into direct response marketing)
Sales team efficiency — if you have a direct salesforce, those employees should be consistently producing sales… perhaps you’ve recently hired additional reps on the team which require training and ramp-up time… otherwise, the MER is a great indicator for struggling performance by the sales team.
Don’t get complacent and treat marketing as a fixed cost. Each $1 going out should produce more than $1 coming back in the form of sales; if not, then investigate your marketing activities and channels.
TL;DR
Fill out your ratio scorecard with your key metrics/ratios and look at the trends (direction) for each metric or ratio
Establish a baseline of performance (i.e. between 5-7%) — baseline > single-point measurement
Identify the 3-5 worst trends (deteriorating) and investigate the inputs for those ratios (like we did in the gross margin & MER examples).
Brainstorm the actions/events in your business impacting each of those inputs for corrective actions.
Repeat this process each month to keep close tabs on your most important measurements.
P.S. reply with a specific trend, measure, metric, or ratio that you find helpful or that you’re struggling to interpret and we’ll take a look!