
A Guide to Scorecards (Part II)
Turn your financials into a literal report card for your business health

How healthy is your business right now (financially speaking)?
As you look to answer this question, you might be checking some figures from your financials:
Are you making money? (i.e. currently profitable)
Is there cash on the balance sheet? (whether it’s enough cash is another question)
Are sales growing or declining? (which direction is the business heading)
Are you consistently making your loan payments each month?
These are the most common starting points among business owners I talk to: sales, profit, cash, debt. But how are you gauging whether it’s “good” or “bad?”
We use what’s called a ratio scorecard to give us these signals.
In our last article, we covered the KPI scorecard (a weekly tracker for operational KPIs), that tool is more tactical in nature with real-time leading indicators. Example: if you’re looking to track outbound sales activity, that’s where you’d find it.
This is different. The ratio scorecard is a monthly tracker built directly from the financial statements. Yes, it’s lagging in nature since those results already happened, but it takes your numbers and transforms them into a “report card” of sorts.
What are metrics and ratios?
First, some definitions. You’ve probably heard terms like ratio, metric, and figure. Here’s how I think about them:
Ratio (narrow) = Something relative to something else. Example: profit (from P&L) divided by revenue (from P&L) = profit margin.
Metric (broad) = Any measurement, financial or non-financial. It’s broader in nature; example: revenue would be considered a metric but not a ratio.
Here are some examples of each:
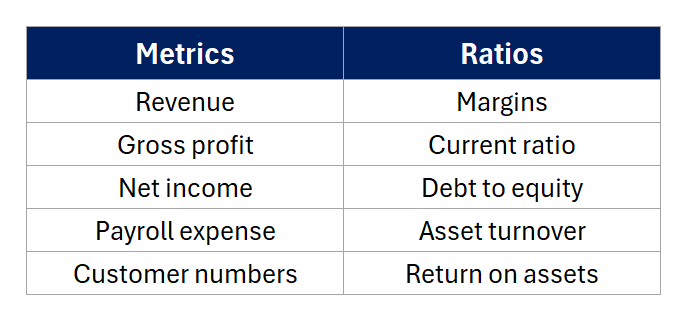
This distinction is important for a few reasons…
While metrics are helpful (let’s say you have a profit target of $100k, you’ll want to see whether profits are actually above or below that level), ratios reveal the true health of the business.
Say you want to compare that $100k profit (a metric) to another business (or your own business from a few years ago), that $100k amount isn’t really comparable without other pieces of information. Now let’s say your profit margin (a ratio) was 10%; you can absolutely compare that margin to past years or a competing business.
Picking the “right” metrics and ratios takes time and refinement. Ideally, you want to track the ones most relevant to your business model and financial situation. Over time, you’ll see patterns and trends which allow you to quickly diagnose problems.
To keep things simple, we’ll focus on four categories of ratios for now: profitability, liquidity, efficiency, and leverage. Each category unpacks a different part of the business.
Four categories of ratios…
1) Profitability — are you making money?
This is the most intuitive category, so it’s a natural starting point.
Gross margin = Gross profit ÷ Revenue
Gross profit is what’s left after you subtract your direct costs for making, selling, servicing, delivering your product or service. Gross margin is your profitability at the sale level (i.e. before paying overhead costs). A 40% gross margin means you’re making $0.40 on every revenue dollar before paying rent, salaries, and everything else.
This is a critical ratio for every business and you’ll want to track it monthly. If it’s trending down, you either have a cost problem or your pricing isn’t keeping pace.
Net profit margin = Net income ÷ Revenue
If gross margin is profitability at the sale level, then net margin is profitability at the entire business level. It’s also known as your “bottom line” since it includes everything (direct costs, overhead costs, interest on debt, etc.). A 10% net margin means you’re taking home $0.10 of every revenue dollar. Industry benchmarks vary widely, but a general rule of thumb = 5% net margin is OK, 10% is solid, and 15%+ is excellent for most small businesses.
Return on assets (ROA) = Net income ÷ Total assets
How much net profit does your business generate for every dollar of assets you own? This one matters more as your business scales and accumulates property, equipment, inventory, and assets in general. A shrinking ROA over time is a signal you’re adding assets faster than you’re adding profit, or your assets are becoming less efficient (or both).
2) Liquidity — can you pay the bills?
Profitable businesses can still go bankrupt (it happens more than you’d think). The reason is almost always liquidity or cash flow issues (i.e. they ran out of cash despite being profitable).
These ratios track cash and cash flow problems…
Current ratio = Current assets ÷ Current liabilities
Current assets convert to cash within a year (cash, receivables, inventory, etc.) while current liabilities are payable within a year (credit cards, payables, short-term debt). The current ratio measures your ability to pay bills coming due.
A ratio above 1.0 means you have more coming in than going out in the near term, below 1.0 is a yellow flag.
A ratio above 2.0 is very comfortable for most businesses. Too high (above 3.0) and you might be sitting on idle cash or excess inventory/receivables that could be working harder (an efficiency problem; albeit a good one).
Quick ratio = (Cash + Receivables) ÷ Current liabilities
This is a more conservative version of the current ratio; it includes only cash and receivables in the numerator. The balance sheet is sorted by liquidity so cash and A/R are the 2 most liquid assets in your business.
If the current ratio measures your ability to pay bills coming due, then the quick ratio measures your ability to generate cash in the short-term. If your quick ratio is below 1.0, you’re more dependent on inventory and other current assets to cover bills. For inventory-centric businesses (retailers, distributors, manufacturers), this is a critical ratio.
3) Efficiency — how well are you managing what you have?
Efficiency ratios measure how effectively your business converts assets into revenue, profit, and cash. These ratios are quite revealing beyond just the profitability line, it’s where I usually find “beneath the surface” problems.
Days Sales Outstanding (DSO) = (Accounts Receivable ÷ Revenue) × 365
How long does it take your customers to pay you on average?
This is your DSO. It measures the average collection period (in days) for your entire business. If DSO is 45, then you’re getting paid every 45 days on average. The lower this number, the better. A rising DSO is a warning sign for cash flow (sales are being collected at a slower pace). This is a great ratio to track across time and industry peers.
Days Inventory Outstanding (DIO) = (Inventory ÷ Cost of goods sold) × 365
How many days of inventory are you sitting on?
Faster (lower) is better. Slow-moving inventory is cash tied up in the business. If DIO is creeping up each month/quarter, then you’re either stockpiling inventory, sales are slowing, or some combination.
Asset turnover = Revenue ÷ Total assets
Every dollar of assets should be generating revenue. This ratio tells you how efficiently that’s happening. If you have $500k in total assets on $1m in revenue, your asset turnover is 2.0, meaning each dollar of assets produces $2 of revenue. Higher is better. This one is best tracked over time to monitor how your efficiency changes as you scale.
4) Leverage — how much debt are you carrying?
Debt has a bad reputation, but when used properly it can create massive wealth (used poorly and it’ll bankrupt you). Here are some ratios to stay on the right side of that equation:
Debt-to-equity ratio = Total liabilities ÷ Owner’s equity
This compares what you owe to what you own (in the business). A ratio of 1.0 means you owe as much as you own. Higher ratios mean you’re more leveraged (more dependent on borrowed money to fund the business). There’s no universal “right” number, but watch the trend over time. A steadily rising debt-to-equity ratio is worth investigating.
Interest coverage ratio = Operating income ÷ Interest expense
Can your business comfortably cover its interest payments? A ratio of 3.0 means your operating income is three times your interest expense (plenty of cushion). Below 1.5 and you’re cutting it close. This ratio is critical if you’re carrying significant amounts of debt or thinking about adding more debt.
Building your scorecard
Consider the ratios mentioned above as a “starter kit” for building your first scorecard.
If you’re doing this for the first time, I’d suggest grabbing your last 3 years of financials and calculating each ratio for that 3-year period. Use this to diagnose where problems are hiding.
As you get comfortable with the process, update your scorecard monthly alongside your financial review. Give each ratio a target based on goals or industry benchmarks. Color-code them red, yellow, green to easily spot trends. After six months, you’ll have a baseline. After a year, you’ll start seeing the “story” behind your numbers.
Ratios do their best work when you track them over time, the trend/direction (i.e. improving or worsening) is far more important than a single point-in-time snapshot. And the more time (data) you have, the more reliable the trend is.
Let’s say your gross margins are 40% while competitors are running 45%. That’s pretty helpful, but it’s more helpful to know last year was 42% and the year before that was 45%. Now we have a real problem to investigate.
Takeaway (TL;DR)
A ratio scorecard takes the financial statements and turns metrics into ratios which help measure the financial health of a business. Track ratios over time to get a sense for improving or worsening trends. This is your “jumping off point” to diagnose problems in the business. Update this scorecard every month and use it as a guide for managing your business.
Next week we’ll look at how to actually use both scorecards together as a decision-making & operating tool (the tactics).