
A Guide to Scorecards (Part I)
Every big company uses this tool and small businesses can too

Imagine you’re a business owner stuck on a remote desert island for ten years with no internet access, can’t contact your team, and can’t see your numbers… nothing.
What one piece of information would you want to see sent to you in a bottle once a week/month/year to know your business is still doing well?
This is an extreme scenario since it would be nearly impossible to gauge overall health with a single piece of information, but hopefully it gets the wheels turning. The “desert island” situation is the thought process behind a scorecard.
Let’s take a closer look at the scorecard — what it is, how to build them, and how to use them. Consider this a primer on one of the most powerful operational & financial SMB tools.
Today will focus on the KPI scorecard (part I), next week will cover the financial (ratio) scorecard (part II, and last we’ll look how to actually use this information (part III).
Definitions
Scorecard — A tool to track and monitor your business’s progress toward goals, objectives, and historic performance. It’s a curated collection of key performance indicators (KPIs).
Key Performance Indicators (KPI) — The underlying measures which tell us how things are going. They can be activity-based, leading, lagging, financial, operational, etc.
Leading — Sales calls, backlog, traffic, call volume, cycle time
Lagging — Turnover, average order value , on-time delivery
Financial — Sales, profit, A/R, billings, collections, cash flow
Non-financial — Labor hours, utilization, inventory units, leads
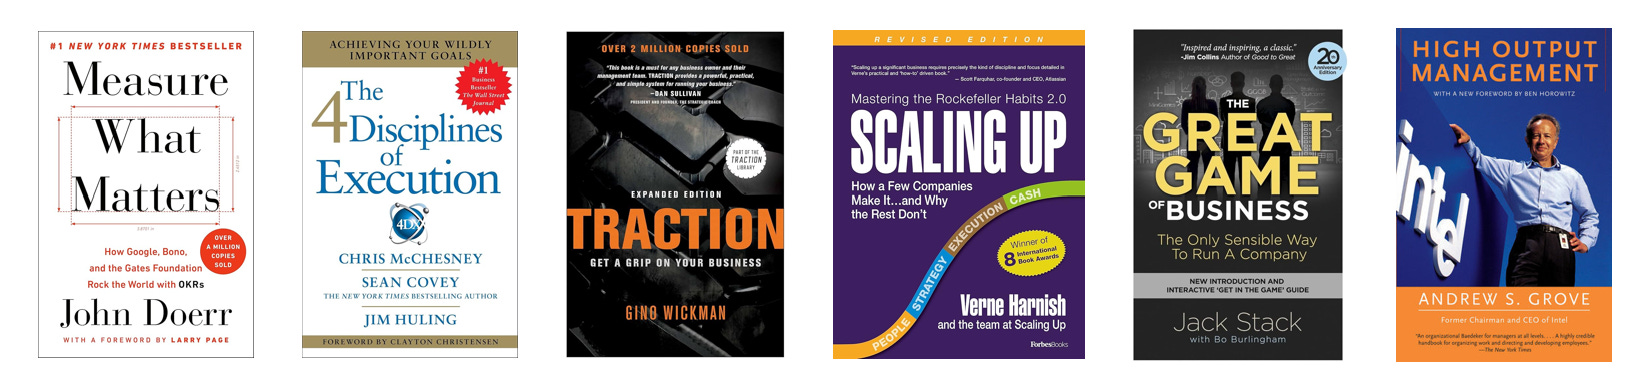
These concepts were popularized by Peter Drucker (“what gets measured gets managed”) in the 1950’s, Andy Grove’s 1983 book High Output Management, and the Robert Kaplan HBR article on the Balanced Scorecard in 1992.
The many types of scorecard
Anything which tracks a measurement (KPI, metric, ratio, financial figure, etc.) over time can be considered a scorecard.
They don’t have to be in a specific format and don’t have to include visuals. If a business is tracking some metric on a regular cadence, then consider it a scorecard.
Some examples:
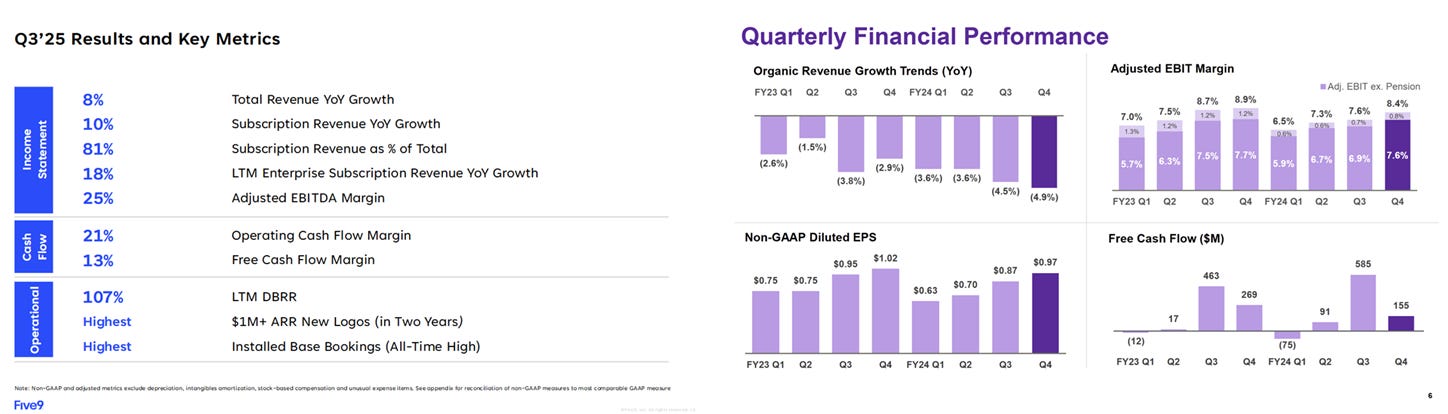
We’ll focus on 2 core tools:
KPI Scorecard — operational in nature on a weekly cadence
Financial (Ratio) Scorecard — financial in nature on a monthly cadence (usually part of a monthly financial review)
The KPI Scorecard
Most KPI scorecards go something like this…
Define your strategy
Set goals aligned with that strategy
Pick KPIs which track progress against goals
Monitor and take action as necessary
The folks who devised this process have likely never experienced the daily knife fight known as running a small business.
The traditional approach may work for larger, more complex organizations; but as an SMB owner, we need something more practical…
Here’s a better approach for tracking operational metrics:
Start with core areas of the business
Select KPIs and metrics tied to each area
Use a mix of leading and lagging indicators
Track a basket of 15-20 metrics weekly and review with team
1) Core areas of the business
Most businesses consist of 5 functional areas:
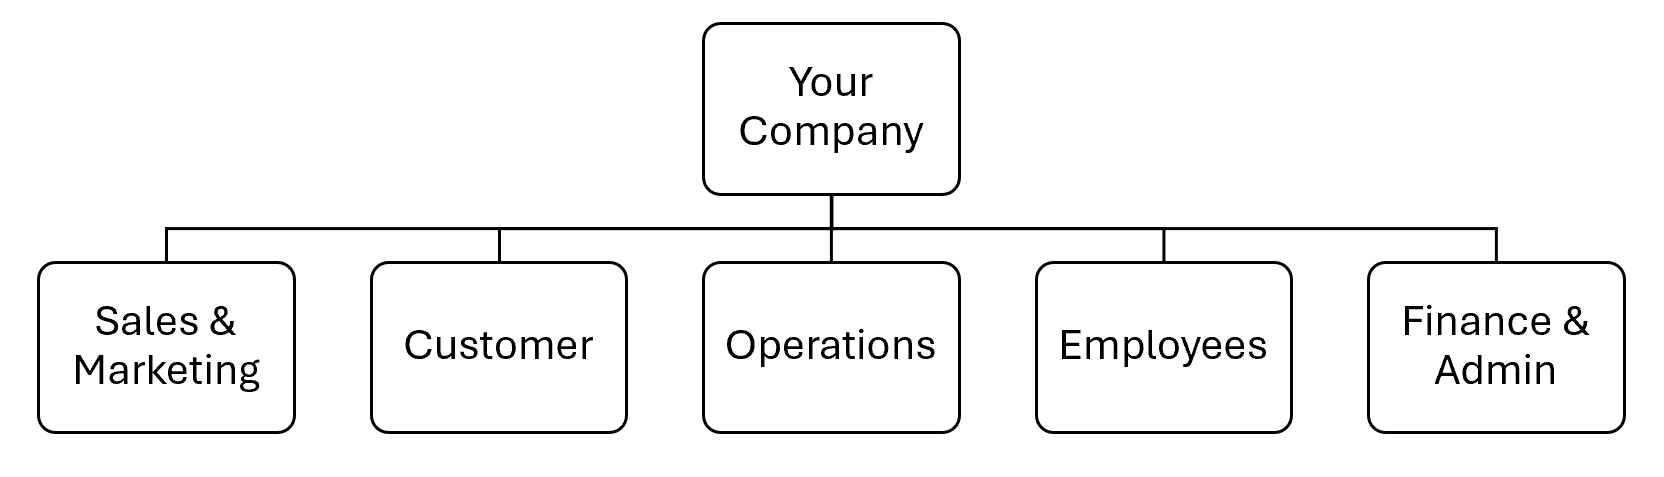
Sales & marketing — finding new leads/prospects and converting them into paying customers
Customers — relationship with existing customers (retention!)
Employees — measuring aspects of your team (productivity, morale, etc.)
Operations — product quality, delivery, service, processes, etc.
Finance & admin — financials and organizational stuff
You could go deeper than this, but it covers just about everything involved in running a company.
Instead of the traditional top-down, goal-driven KPI process; most businesses would be better served to track a “bottom-up” basket of metrics across these 5 functional areas.
If we can keep the list of metrics to 15-20, then we can get a complete view of business performance in a single view. Sweet. It’ll look something like this:
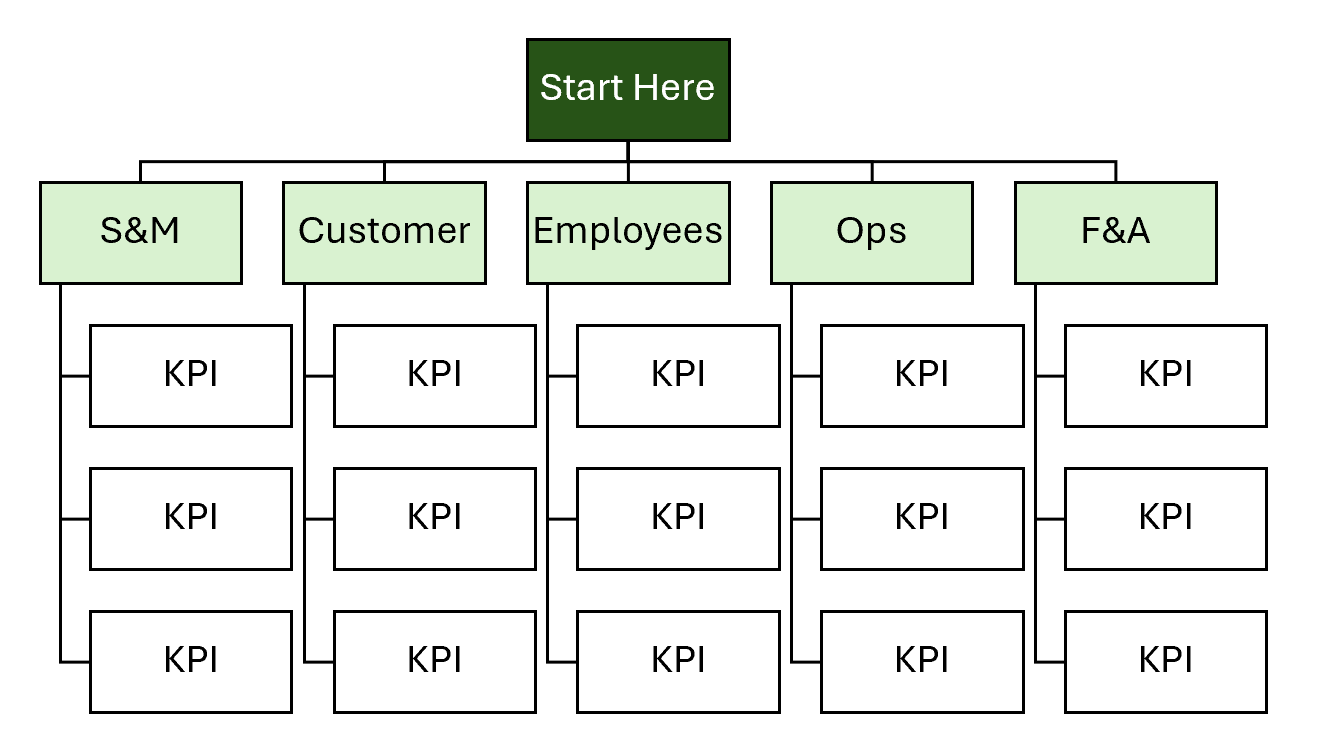
2) Select KPIs and metrics tied to each area
Again, the formula is:
5 functional areas of a business
3-4 metrics each
15-20 metrics in total (single page view is the goal)
The selected 3-4 metrics should give you a clear picture of how that functional area is performing. For example, maybe I’m a newly-opened business and revenue is scaling quickly; I probably want to focus my operational metrics around capacity (when do I need to hire/add), service quality (make sure all those new customers are happy), and repeat customer rate (make sure all those new customers are coming back).
Anything can be measured. Let’s say you care about “making things easier” to run. Even that can be measured. Example:
Goal = “make things easier” by reducing my return-on-headache
KPI suggestions:
Number of clients that call/email more than twice per week (customer)
Frequency of refunds/returns/complaints (customer)
Manual touches per transaction (sales)
[P.S. scroll down to the bottom of this article under the section titled “Appendix: KPI List” to find a list of sample KPIs.]
3) Use a mix of leading and lagging indicators
Consultants will tell you to stick with only “activity-based leading indicators” like number of phone calls, backlog, touch points, utilization, etc.
Leading indicators are great, but they’re overrated when you’re trying to BOTH track progress toward a goal AND get a quick pulse on overall business performance (i.e. real-time health)
When it comes to activity-based metrics, I prefer the OKR framework (objectives and key results). You have an objective (grow by 20%) and some key results to achieve the objective (outbound activity of 100 per week, hire new sales rep, ask for 20 referrals). Some of these key results are one-and-done actions as opposed to true KPIs (like hiring a key employee).
Instead, our KPI scorecard should track a mix of current (lagging) performance and leading indicators.
Here’s an example of a potential scorecard for Profit Mastery:
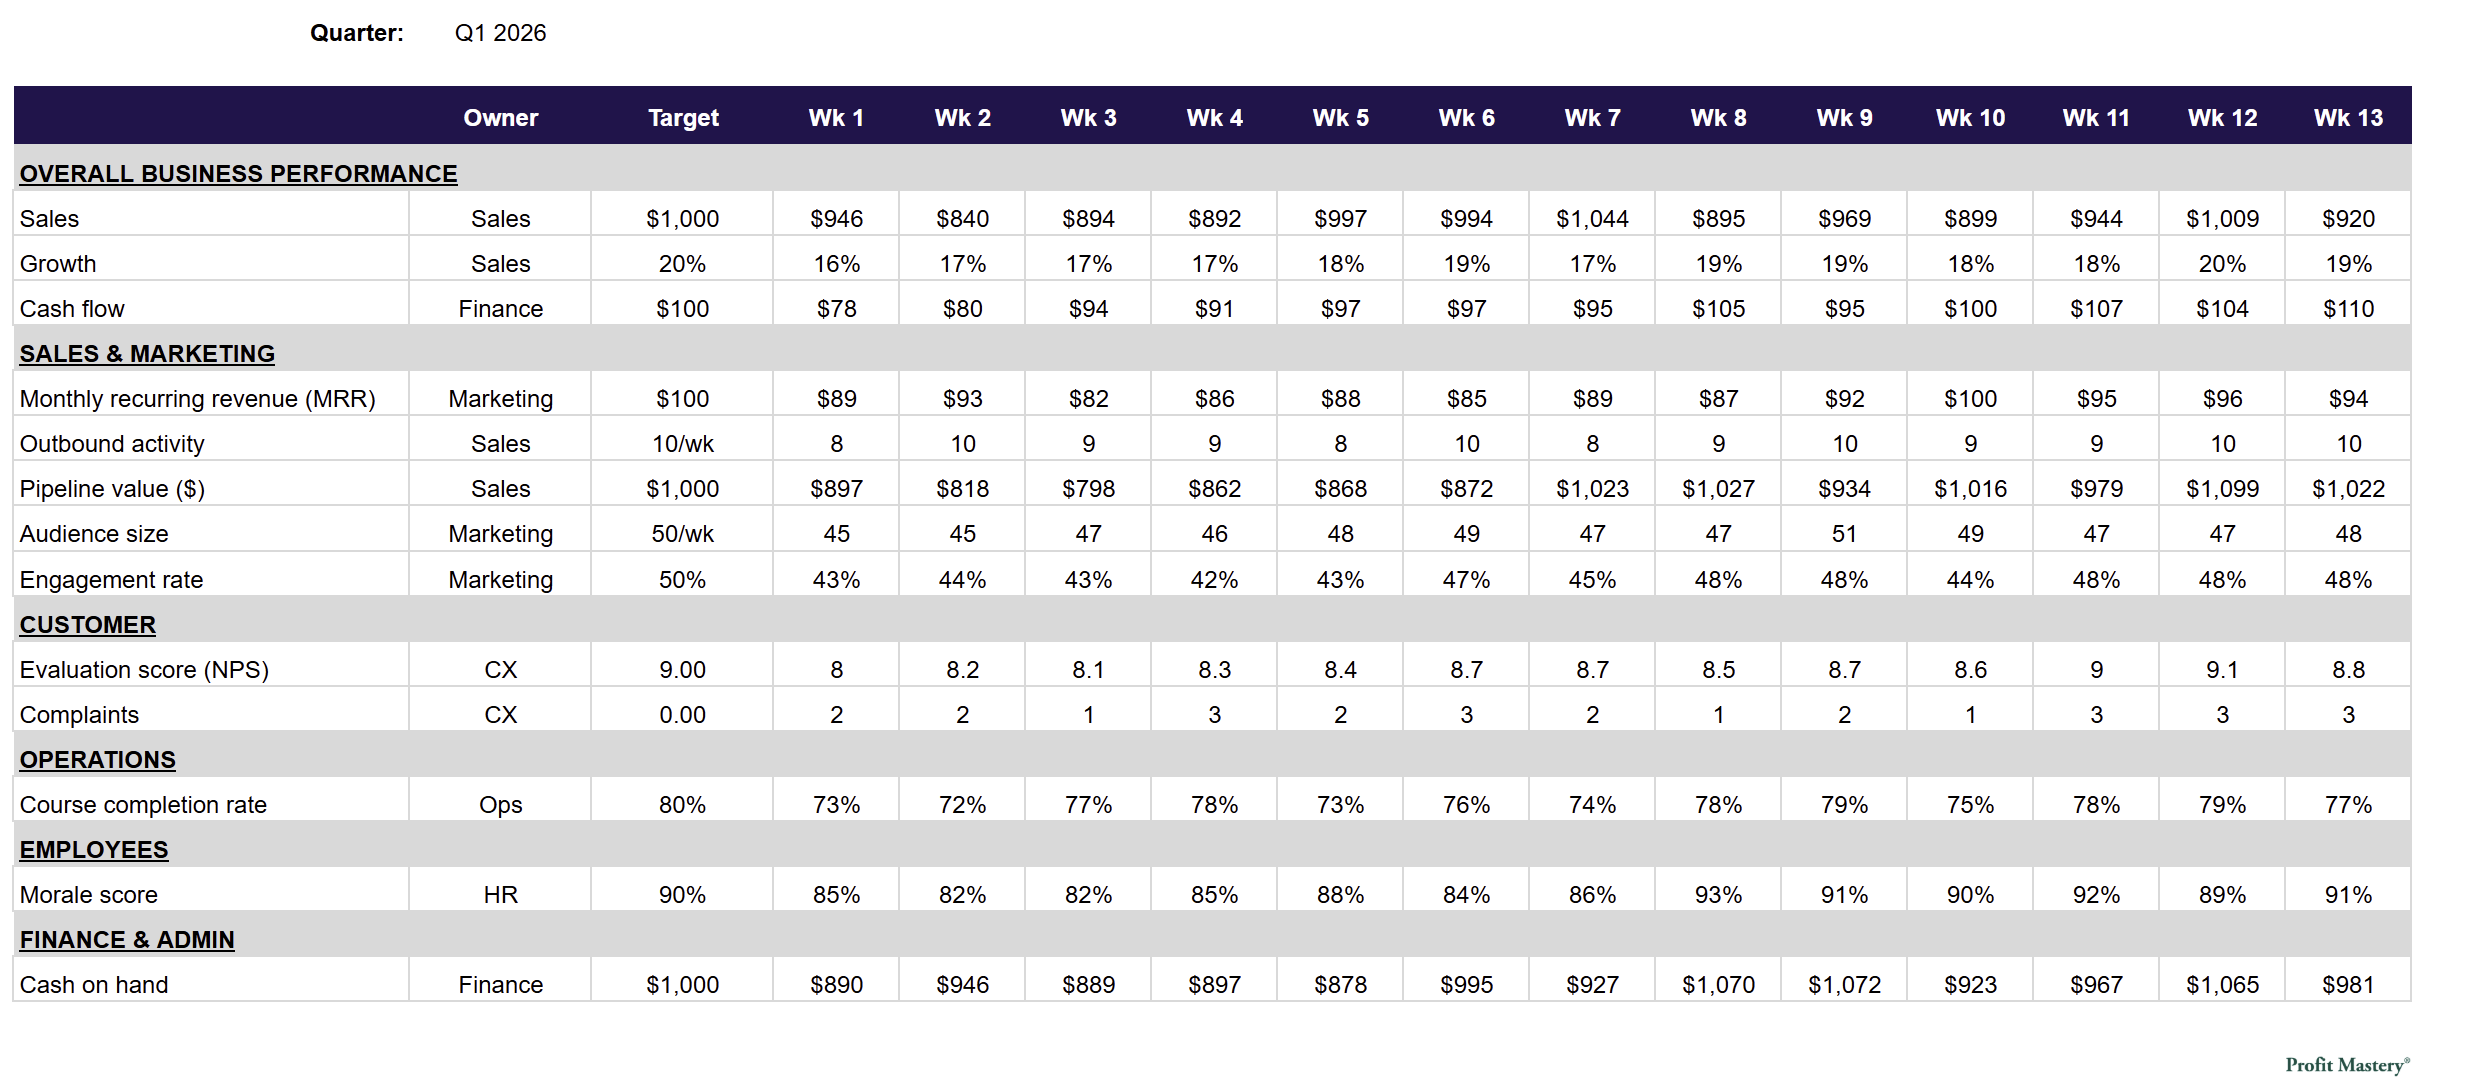
4) Track a basket of 15-20 metrics weekly and review with team
Every passing week brings us new information about our business. After we’ve gathered enough data (maybe 4-6 weeks), we’ll see baseline performance levels and can set targets.
Let’s unpack the example above…
First, I could (and should) start by color-coding performance levels above-or-below my targets. Then, I can add some visuals to see how each metric is trending.
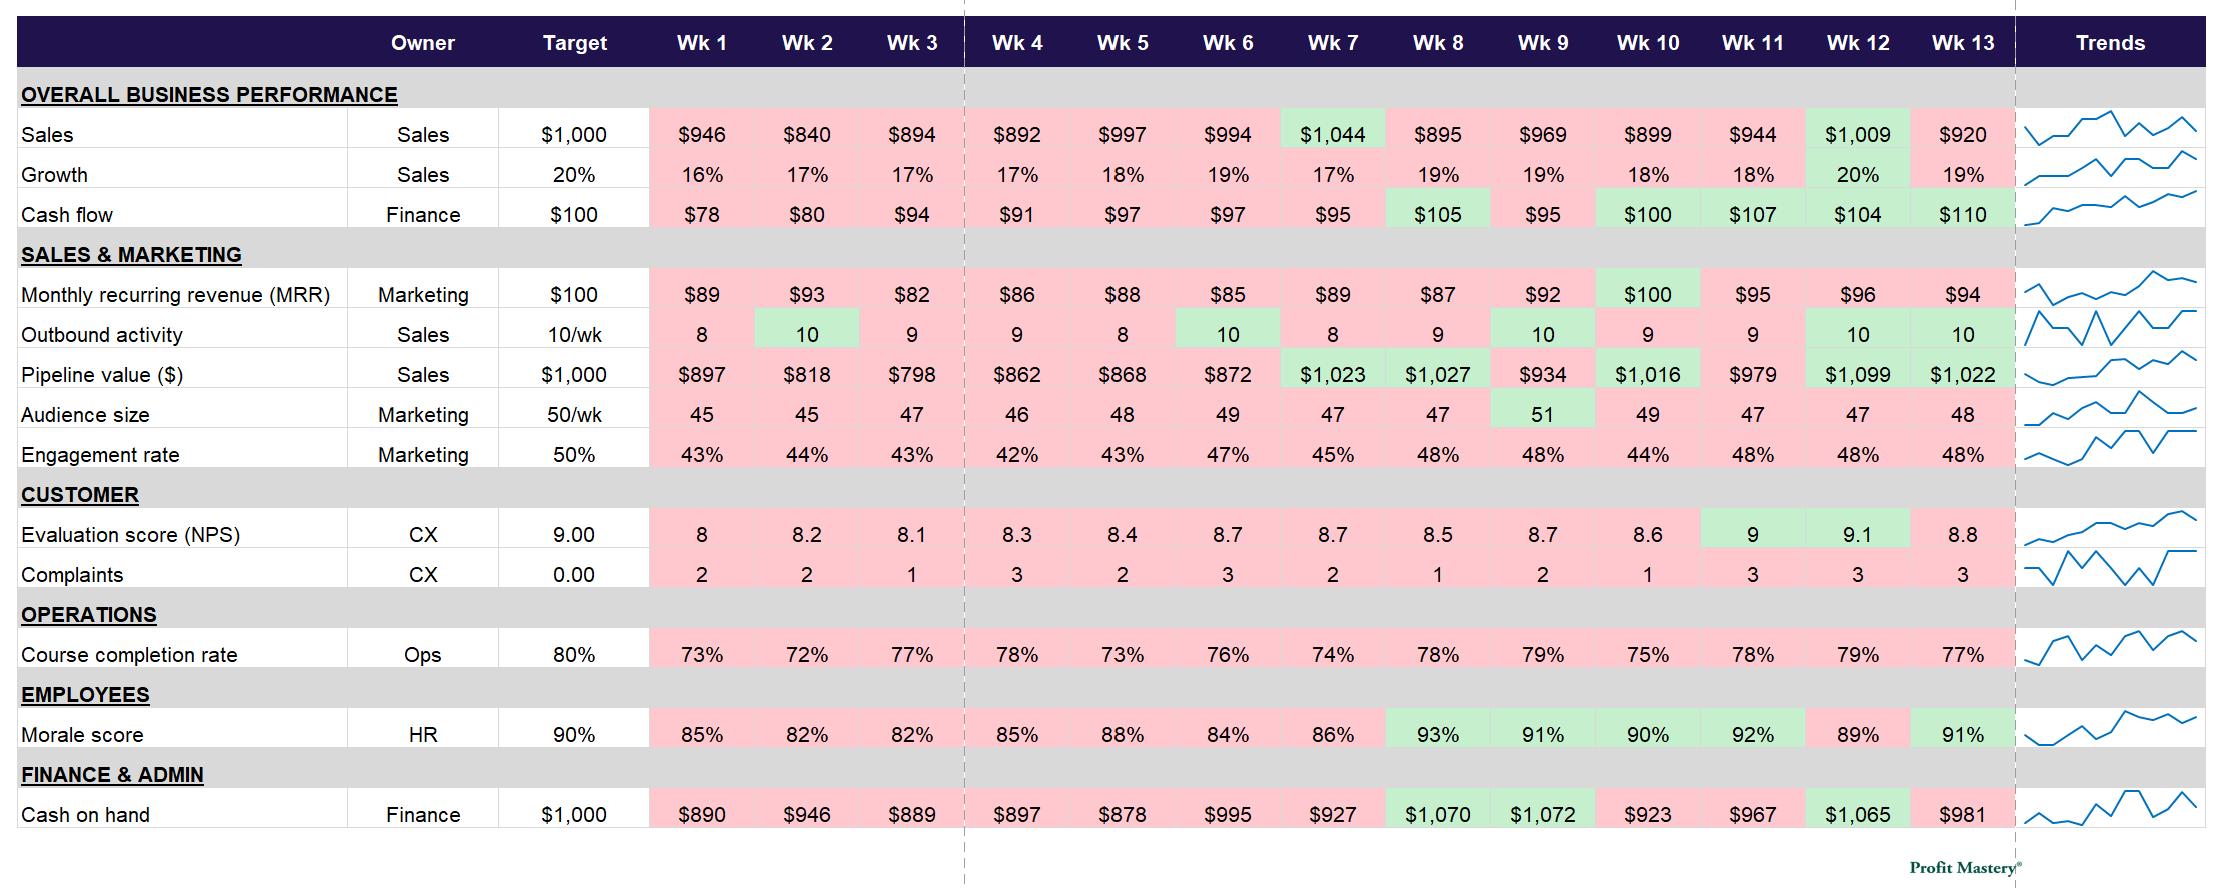
Sure, it may look like a Christmas tree, but at least it’s very clear that I’m operating below my targets (though I’m seeing more “green” popping up recently). Something I may want to consider here is adding a “yellow” for metrics within an acceptable range.
Next week, we’ll look at the financial (ratio) scorecard in part II and in part III we’ll cover how to use the information from our weekly operational scorecard and monthly financial scorecard (i.e. a decision-making framework).
P.S. like and share this post and we’ll drop a link to the template + KPI list in the comments.
TL;DR
The KPI scorecarding process — Grab a piece of paper. Brainstorm 3-4 metrics for each of your 5 core business functions (sales & marketing, customer, operations, employees, finance & admin) for a total of 15-20 metrics. Remember, these are what you’ll get while on a desert island. Track those metrics weekly and look for consistent performance (your baseline) and improving trends. Each quarter, swap out metrics that aren’t working.
Appendix: KPI List
1) Sales
Pipeline value ($) (leading, financial) — Forecasts future revenue and effectiveness of sales reps / process
Qualified leads (leading, operational) — Top-of-funnel sales activity (i.e. the transition from marketing to sales), early signal of future pipeline
Close rate (lagging, operational) — Sales efficiency (converting qualified leads into closed business)
Average deal/order size (lagging, financial) — Tracks revenue efficiency, up-sell & cross-sell efficiency, and sales mix (i.e. higher ticket vs. lower ticket offerings)
Sales cycle (leading, operational) — How fast is the timeframe from prospect to closed business? Also has downstream measurement for ops/capacity planning
Revenue per sales rep (lagging, operational) — Individual productivity of sales team; also a measure of ROI on sales dollars
2) Marketing
Qualified/interested leads (leading, operational) — Measures quantity of interested leads coming out of your marketing activities
Cost per lead (leading, operational) — Tracks marketing efficiency; big implications on unit economics and overall profitability
Visitors / traffic (leading, operational) — Overall level of visitation / potential customers (harder to capture in B2B and brick-and-mortar retail)
Followers / subscribers / audience (leading, operational) — Tracks the overall size of your audience which has revenue-generating potential
Conversion rate (leading, operational) — Indicator of advertising effectiveness to turn cold visitors into qualified leads/prospects (or paying customers)
Customer acquisition cost (CAC) (lagging, operational) — Fully loaded cost to win a customer; key component of unit economics
Return on ad spend (ROAS) (lagging, operational) — How much revenue is generated by paid advertisements
3) Customer
Net Promoter Score (NPS) (leading, operational) — Tracks level of customer happiness; predictor of both future referrals and potential customer churn
Customer churn rate (lagging, operational) — Measures customer cancellations; good indicator of quality or service issues
Customer lifetime value (CLV) (lagging, operational) — Quantifies total value of a customer relationship; indicator for S&M investments
Support ticket volume & response time (leading, operational) — Rising volume or slow response times are leading indicators of customer churn
Customer complaints (leading, operational) — Indicator of service issues and potential customer churn
4) Employees
Employee engagement score (leading, operational) — Predicts retention, productivity, and culture health
Voluntary turnover rate (lagging) — Measures the cost and disruption of losing talent; high rates erode institutional knowledge
Revenue per employee (lagging, financial) — Core labor productivity metric; easy to benchmark based on industry
Labor margin (lagging, financial) — Labor productivity metric; good indicator for over/under-staffed situations
5) Operations
On-time delivery rate (lagging, operational) — Late shipments are an indicator of service quality
Capacity utilization (leading, operational) — How much of your resources are in use (team, equipment, etc.); good indicator for potential quality issues and/or hiring needs
Order cycle time (leading, operational) — Time from order to delivery; shorter times = better customer experience
Defect/error rate (lagging, operational) — Frequency of issues/errors; both financial impact (refunds, rework, etc.) and customer churn impact (lower repeat business)
Inventory turnover (lagging, operational) — Efficiency of inventory management and tracking; good indicator for cash flow
6) Finance/Admin
Revenue/growth (lagging, financial) — Heartbeat of a business; every company should know YoY down to a weekly level
Gross margin (lagging, financial) — Profitability at sale level; indicator of scalability/viability of the business model
Operating cash flow / cash runway (leading, financial) — Predicts how long the business can operate; crucial for turnarounds
Budget variance (lagging, financial) — Highlights forecasting capability; overruns indicate poor planning or expense creep
Copy of the template and KPI list here:
https://docs.google.com/spreadsheets/d/1c8eQ4eO3NI23oFJmllloMg0EK46mrAYRCqDjuUdJeJs/edit?usp=sharing